- Published on
Using Claude Code as an AI Engine for Automated Quant Research
What if you could hand an AI a dataset of 53 commodity futures spanning 10 years, tell it to "find trading signals," and come back to a ranked leaderboard of backtested factors — some delivering 1.7+ Sharpe ratios out of sample?
That's what I built with QuantaAlpha: an autonomous factor mining framework where Claude Code acts as the reasoning engine inside an evolutionary loop. No manual hypothesis writing, no hand-tuning expressions. The AI generates ideas, writes code, runs backtests, critiques its own results, and evolves better factors over multiple rounds.
Here's how it works and what it found.
The Problem: Alpha Factor Discovery is Slow
Traditional quant research follows a painful loop: a researcher forms a hypothesis, translates it into a mathematical expression, codes it up, backtests it, analyzes results, and iterates. Each cycle takes hours or days. Most hypotheses fail. The search space is enormous — combinations of lookback windows, signal types, filters, and normalizations across dozens of instruments.
I wanted to automate the entire loop and let an AI explore the space faster than any human could.
The Architecture: Claude Code Inside an Evolution Loop
The system wraps Claude Code in a multi-phase evolutionary pipeline. Each factor goes through three AI-driven steps, and the population of factors evolves through mutation and crossover — inspired by genetic algorithms.
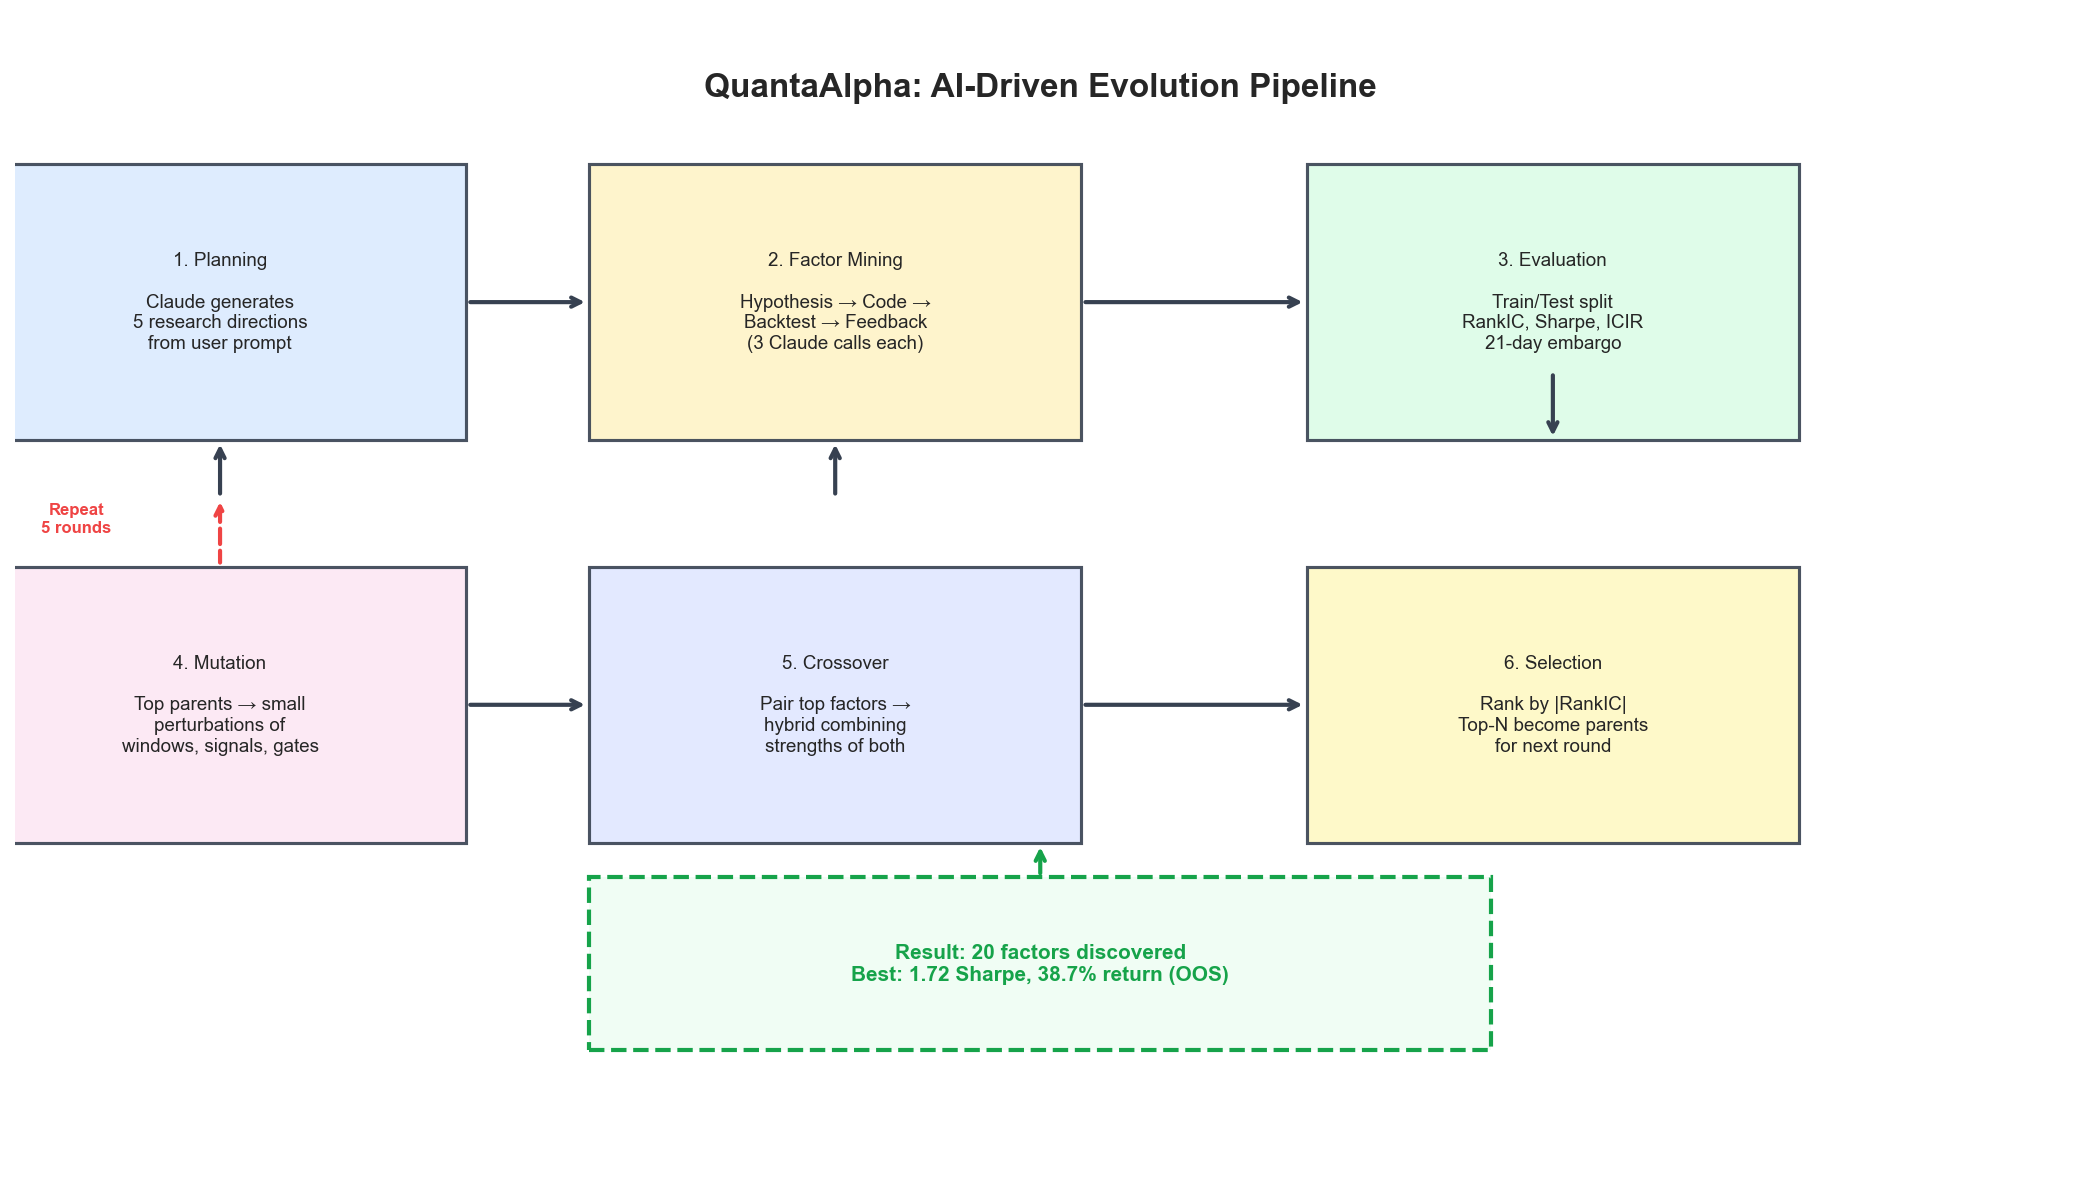
Phase 1: Planning
Given a high-level direction like "commodity futures momentum and mean-reversion factors", Claude generates 5 diverse research directions:
- Short-term momentum with volume confirmation — trending moves backed by abnormal volume
- Long-term mean-reversion — z-scores of price deviation from moving averages
- Intraday range-based regime detection — volatility expansion as a momentum filter
- Cross-sectional sector rotation — relative strength acceleration across commodity sectors
- Volume-price divergence — contrarian signals when price leads without volume confirmation
Each direction becomes a separate exploration branch.
Phase 2: Factor Mining (3 Claude Calls per Factor)
For each direction, the system makes three sequential Claude Code calls:
Call 1 — Hypothesis Generation: Claude receives the research direction and any feedback from prior attempts. It produces a structured hypothesis with an observation, justification, and precise specification using a domain-specific language (DSL) of 60+ operators.
Call 2 — Code & Backtest: Claude writes the factor implementation using the DSL, executes it against the dataset, and runs a full backtest. If the code errors, Claude debugs and retries (up to 3 attempts).
Call 3 — Feedback & Analysis: Claude evaluates the backtest metrics on training data only (test metrics are hidden to prevent overfitting), compares against the current best factor, and proposes a specific next hypothesis.
Phase 3: Evolution (Mutation + Crossover)
After the initial 5 factors are mined, the system enters an evolutionary loop for 5 rounds:
Mutation: The top-performing parent factors get small perturbations — changing lookback windows, adding filters, switching signal types, or adjusting normalization. Claude analyzes each parent's strengths and weaknesses to propose targeted improvements.
Crossover: The top-4 factors are paired, and Claude generates hybrid factors that combine the best elements of each parent — for example, using one factor's momentum signal with another's volume gating logic.
Selection: After each round, all factors are ranked by absolute RankIC (Spearman correlation with forward returns). The best become parents for the next round.
The Data
The system operates on a universe of 53 commodity futures contracts spanning 10 years (Feb 2016 – Feb 2026), covering FX pairs, metals, energy, agriculture, crypto, and rates. Total: ~2,516 trading days, with a strict train/test split at Dec 31, 2022 and a 21-day embargo gap to prevent lookahead bias.
The DSL: How Factors Are Expressed
Rather than letting the AI write arbitrary Python (which would be hard to validate and compare), factors are expressed in a constrained domain-specific language. This keeps the search space structured while remaining expressive.
The DSL includes 60+ operators organized into categories:
# Time-series operators (per instrument, rolling window)
TS_MEAN($return, 20)       # 20-day rolling mean
TS_ZSCORE($close, 60)      # 60-day rolling z-score
TS_RANK($volume, 10)       # Percentile rank in 10-day window
EMA($close, 20)            # Exponential moving average

# Cross-sectional operators (across all instruments per day)
RANK(expr)                 # Percentile rank across all 53 commodities
MEAN(expr)                 # Cross-sectional average

# Conditional logic
WHERE(condition, val_a, val_b)   # Ternary: if condition then a else b
GT(a, b), LT(a, b)              # Comparisons

# Arithmetic
MULTIPLY(a, b), DIVIDE(a, b), SUBTRACT(a, b)
A factor expression gets parsed into executable Python that operates on multi-indexed DataFrames. Here's what a real AI-generated factor looks like:
RANK(
  WHERE(
    GT(TS_ZSCORE(TS_STD($return, 5), 20), 0.5),
    TS_ZSCORE($return, 5),
    TS_ZSCORE($return, 20)
  )
)
This one says: "If recent 5-day volatility is unusually high (z-score > 0.5), use short-term momentum. Otherwise, use medium-term momentum. Rank across all commodities." — a regime-adaptive momentum factor that the AI designed through evolution.
Results: What the AI Found
Over one run, the system explored 20 factors across 5 evolution rounds. Here are the headline results from the out-of-sample test period (Jan 2023 – Feb 2026):
| Metric | Value |
|---|---|
| Total factors explored | 20 |
| Factors with positive test RankIC | 16 (80%) |
| Best test Sharpe ratio | 1.72 |
| Best test annualized return | 38.7% |
| Best test max drawdown | -15.8% |
| Best test RankIC | 0.024 |
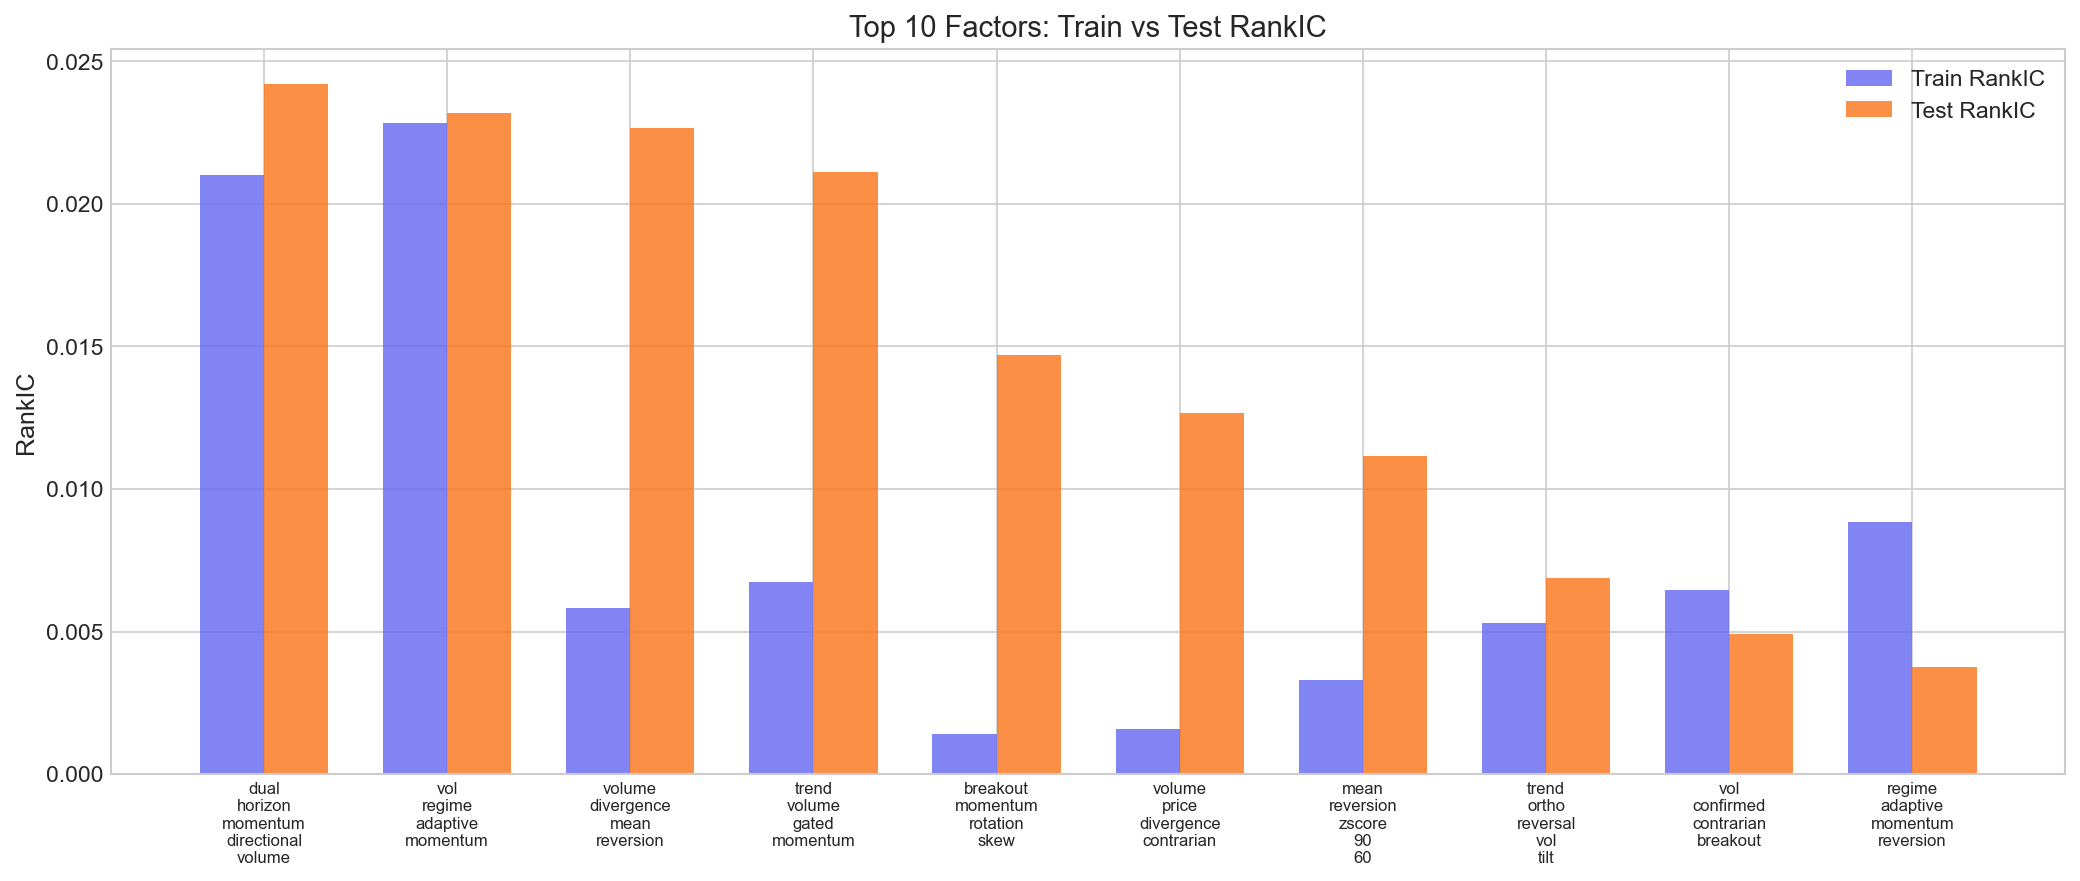
The bar chart above shows train vs. test RankIC for the top 10 factors. Several factors show strong alignment between train and test — a sign of genuine signal rather than overfitting.
The Top 5 Factors
1. Vol Regime Adaptive Momentum (Crossover, Round 5)
- Test Sharpe: 1.72 | Test Return: 38.7% | Max Drawdown: -15.8%
- Switches between 5-day momentum in high-volatility regimes and 20-day momentum in calm regimes. Gated by close position within the daily range and scaled by volume rank.
- This was the best risk-adjusted performer — the evolutionary process combined a volatility-adaptive horizon selection with a directional confirmation filter discovered in earlier rounds.
2. Dual Horizon Momentum with Directional Volume (Crossover, Round 4)
- Test Sharpe: 1.18 | Test Return: 25.7% | Max Drawdown: -17.9%
- Blends 5-day and 10-day return z-scores (weighted 2:1), confirmed by the position of the close within the daily range, and scaled by volume regime.
3. Volume Divergence Mean Reversion (Crossover, Round 1)
- Test Sharpe: 0.42 | Test Return: 9.5% | Max Drawdown: -19.6%
- Detects price-volume divergence: when price extends beyond the 20-day SMA without volume confirmation, it bets on mean reversion. A blend of two initial research directions.
4. Trend Volume Gated Momentum (Mutation, Round 3)
- Test Sharpe: 1.11 | Test Return: 25.1% | Max Drawdown: -21.8%
- EMA-based trend (20-day vs 60-day) that only activates when 5-day average volume exceeds the 20-day average. Filters out low-conviction moves.
5. Breakout Momentum with Rotation & Skew (Crossover, Round 1)
- Test Sharpe: 0.69 | Test Return: 14.9% | Max Drawdown: -23.2%
- 5-day return z-score amplified by volatility expansion, with cross-sectional rotation acceleration and a positive skew filter.
Cumulative Returns
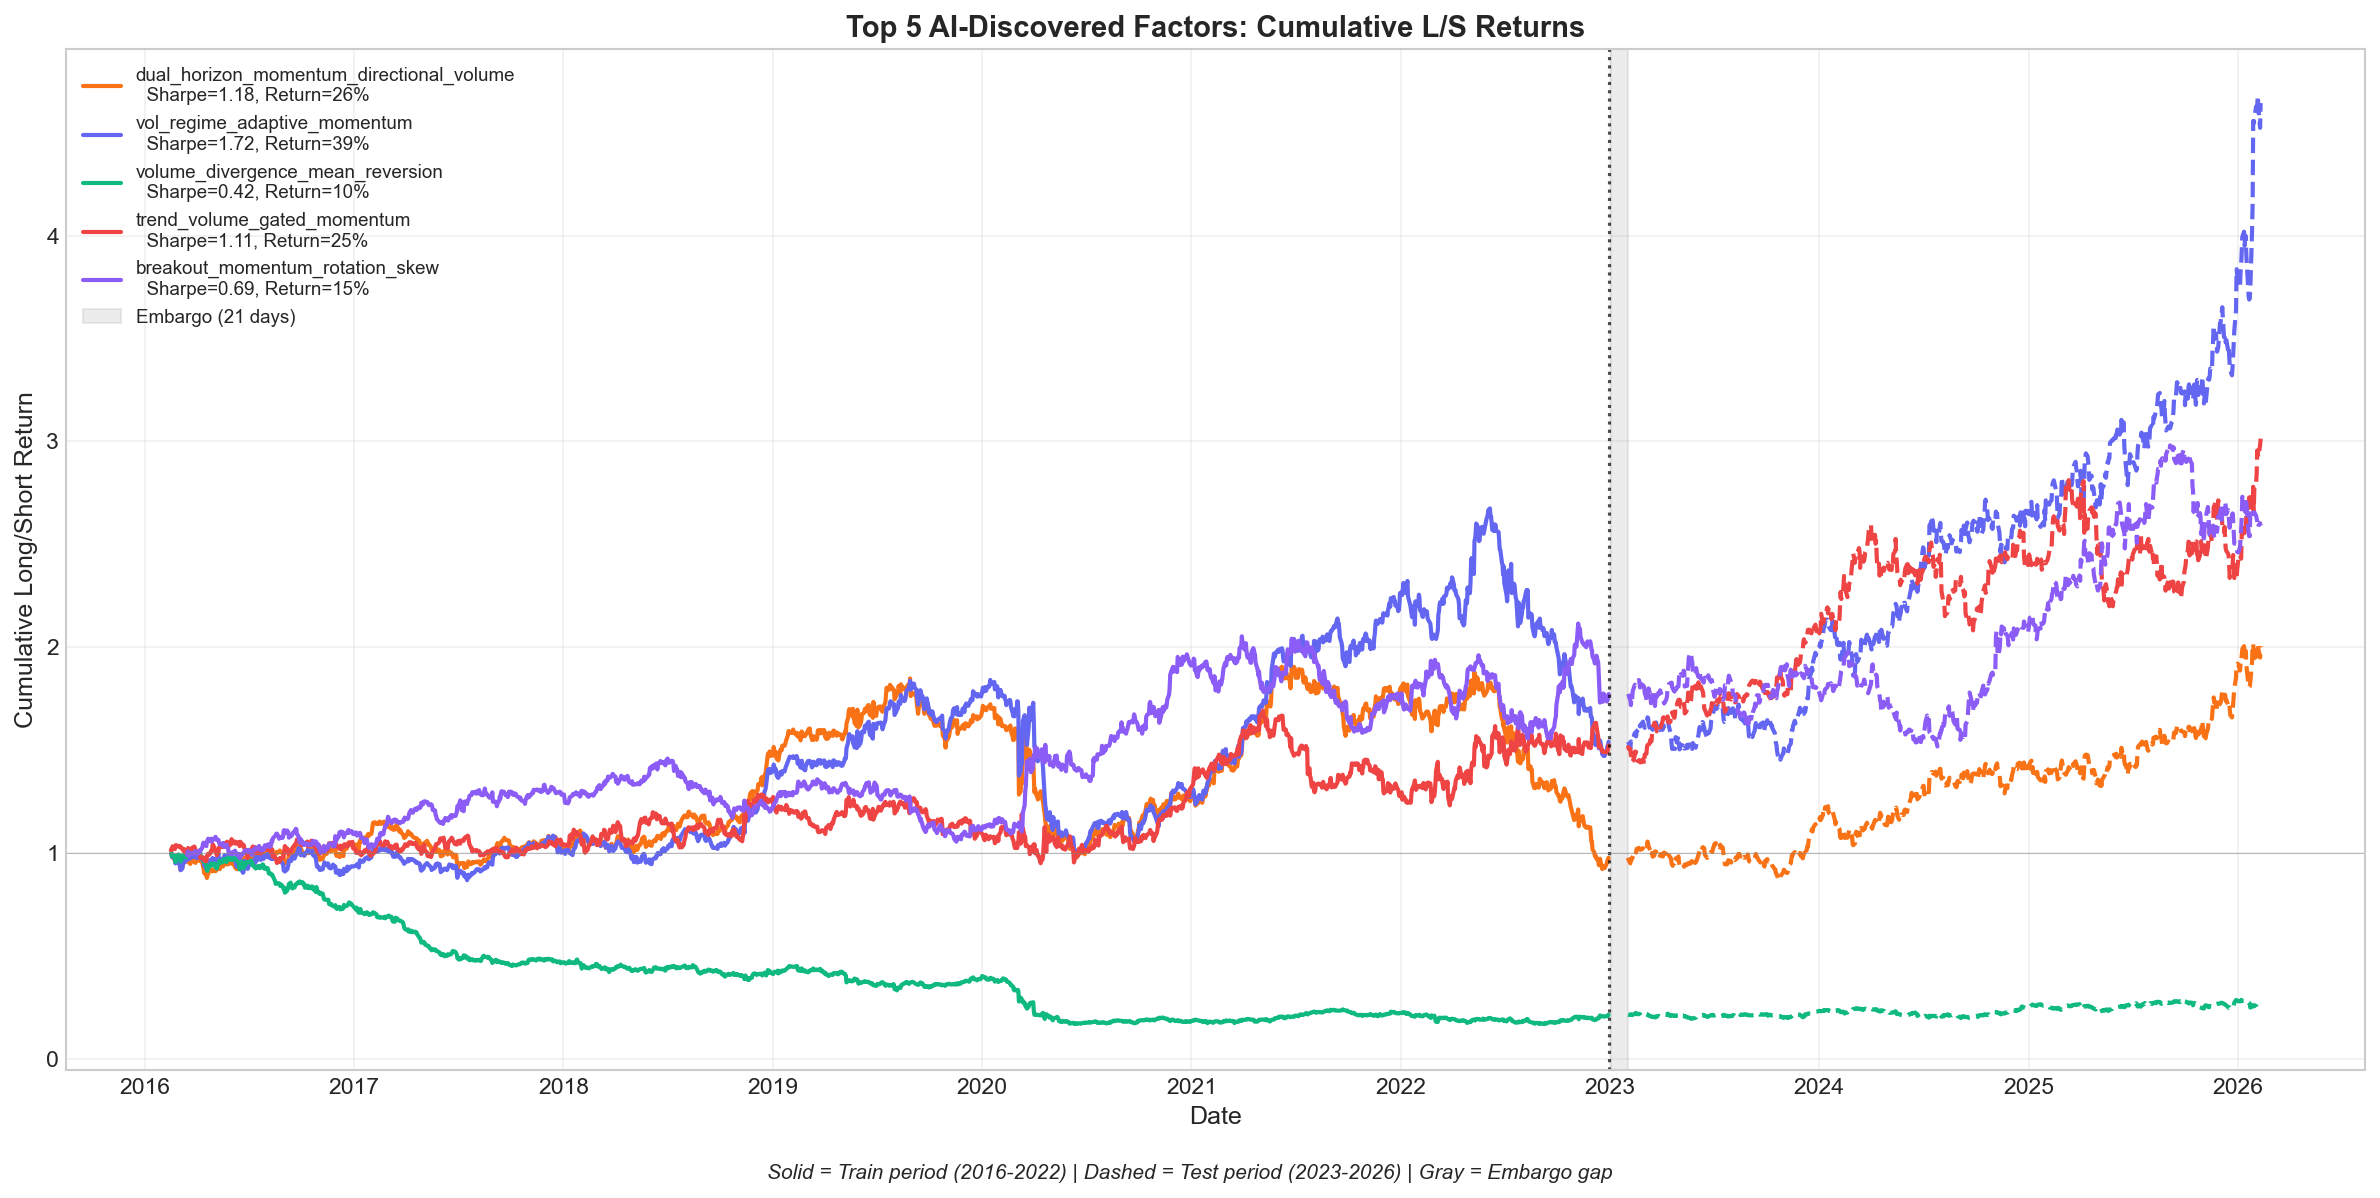
The cumulative L/S (long top 5, short bottom 5 commodities) return chart shows solid equity curves that continue into the out-of-sample test period (dashed lines after the vertical boundary). The best factor grew capital roughly 5x over the full period, with the test-period performance often exceeding the training period.
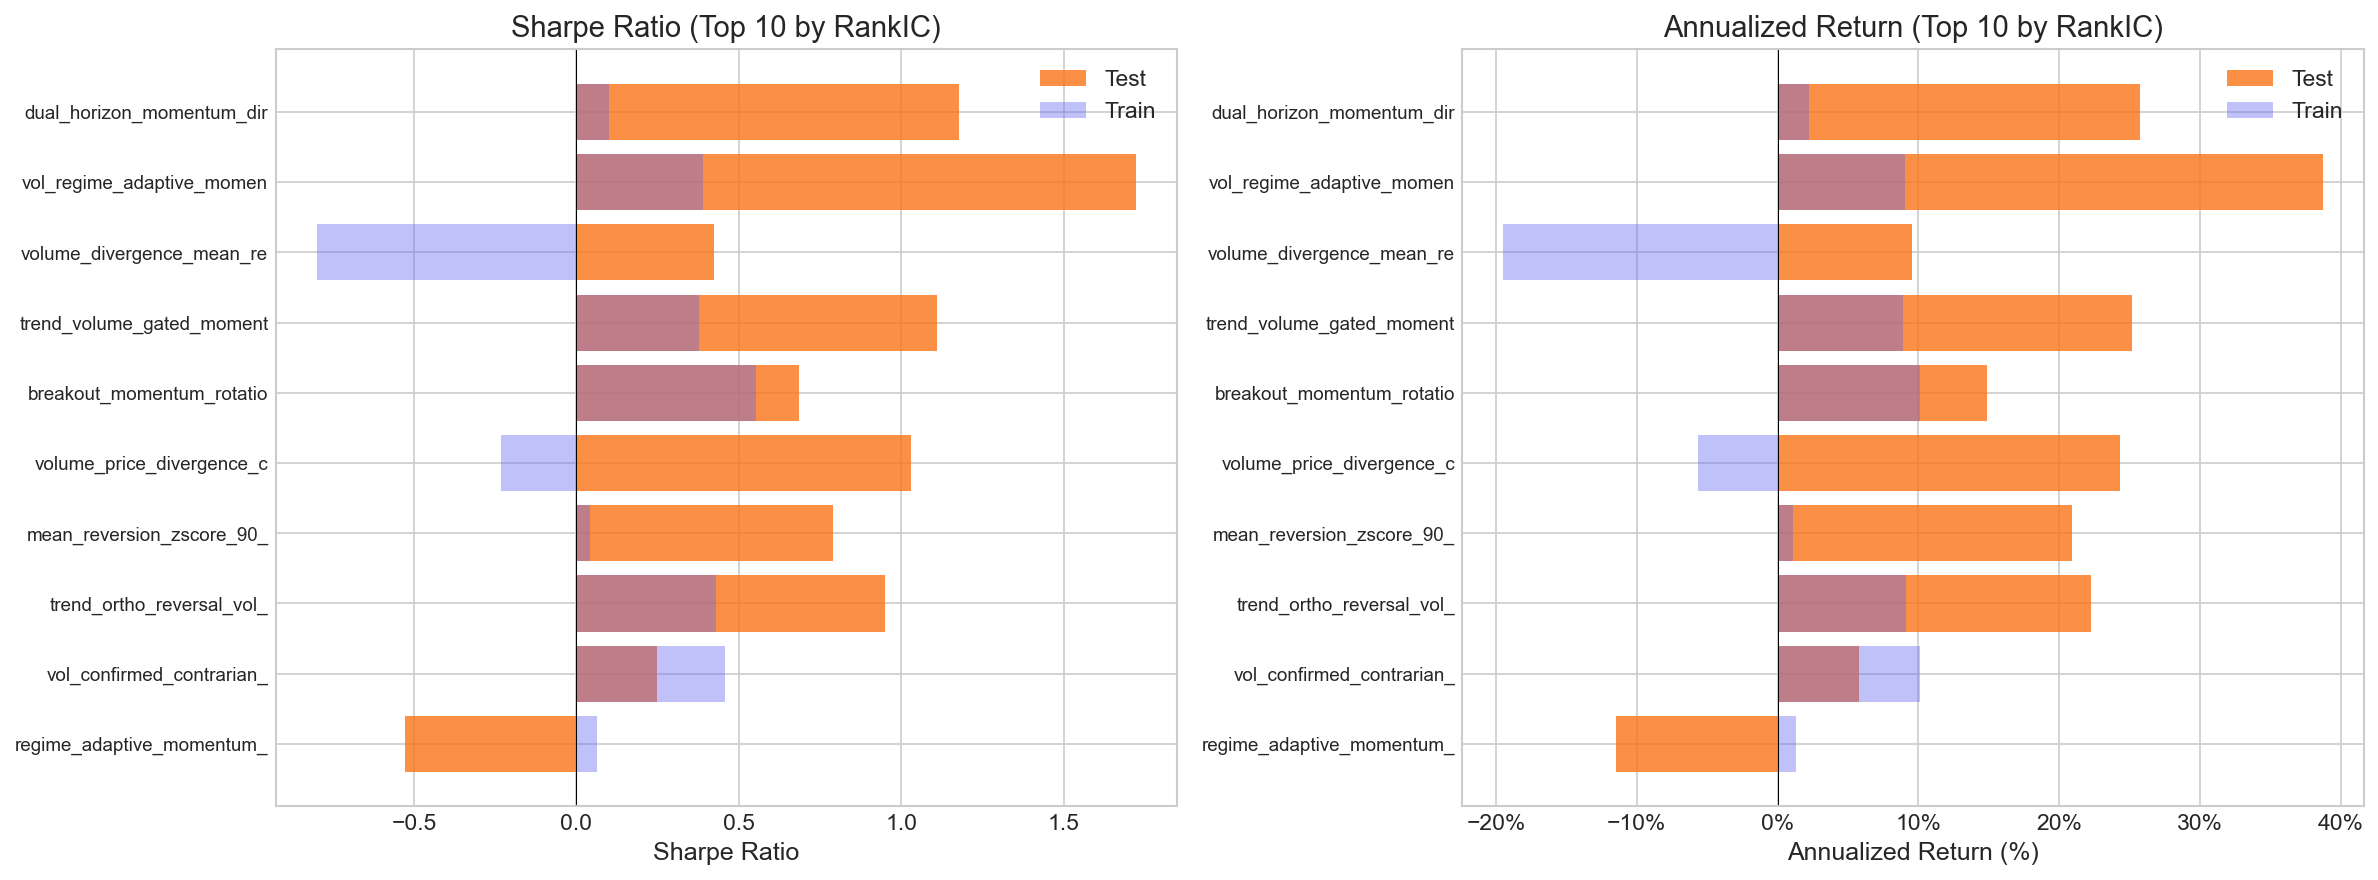
Risk-Return Profile
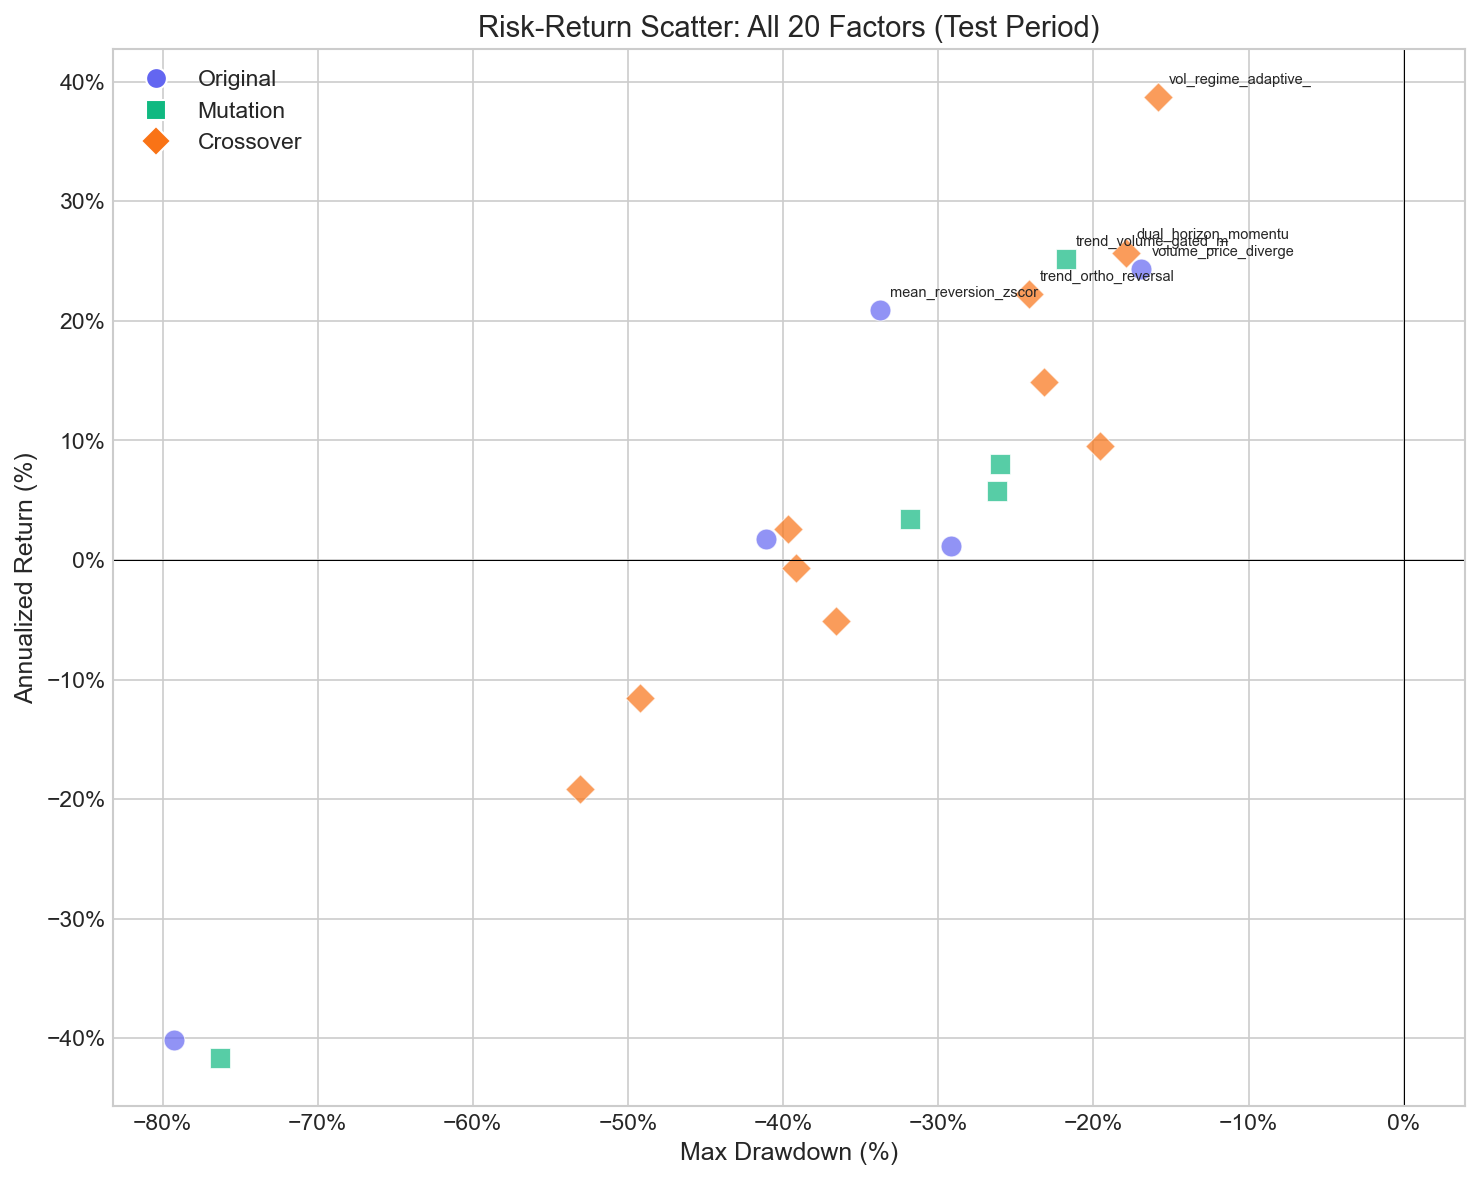
The scatter plot reveals a clear pattern: crossover factors (orange diamonds) cluster in the upper-right quadrant — higher returns with moderate drawdowns. Original factors (purple circles) show more dispersion, while mutation factors (green squares) land in between. The evolutionary process systematically shifts the population toward better risk-adjusted returns.
Best Strategy Deep Dive: Vol Regime Adaptive Momentum
The top factor by risk-adjusted return — Vol Regime Adaptive Momentum — emerged in the final crossover round (Round 5) and generated a 1.72 Sharpe ratio with 38.7% annualized return out of sample. Here's what its trading activity looked like.
Trading volume: The strategy made 7,610 position-days across the 763-day test period (5 long + 5 short positions daily), touching 52 of the 53 instruments in the universe. Some instruments appeared in the portfolio far more often than others — Micro E-mini Dow (MYMF) was selected on 449 of 763 days, while others like Palladium (PAF) appeared fewer than 90 days.
Most profitable instrument: Natural Gas (NGF) dominated the P&L, contributing +136.9% in cumulative returns during the test period — roughly a third of the strategy's total gains. This came from both the long side (+84.7% from 96 long days) and the short side (+52.2% from 92 short days). Natural gas's extreme volatility and regime-switching behavior made it an ideal fit for a factor that explicitly adapts its lookback window based on volatility regimes.
Other top contributors included Ethereum futures (ETHF, +61.2%), Bitcoin futures (BTCF, +56.7%), and KC HRW Wheat (KEF, +54.4%) — a mix of crypto and agricultural commodities where volatility-adaptive momentum captures genuine trend shifts.
Biggest loss-generating instrument: Oat Futures (ZOF) was the worst performer, losing -90.3% cumulatively in the test period — a significant drag. The losses came from both sides: -42.0% on long positions and -48.3% on shorts. Oats is a thinly traded market where the factor's volatility regime detection likely generated false signals from illiquidity-driven price spikes rather than genuine momentum.
Cotton (CTF) was the second-worst performer (-40.7%), primarily from the long side, despite being the third most frequently traded instrument (426 days). High frequency of selection combined with poor signal quality suggests cotton's price dynamics don't align well with the momentum-volatility framework.
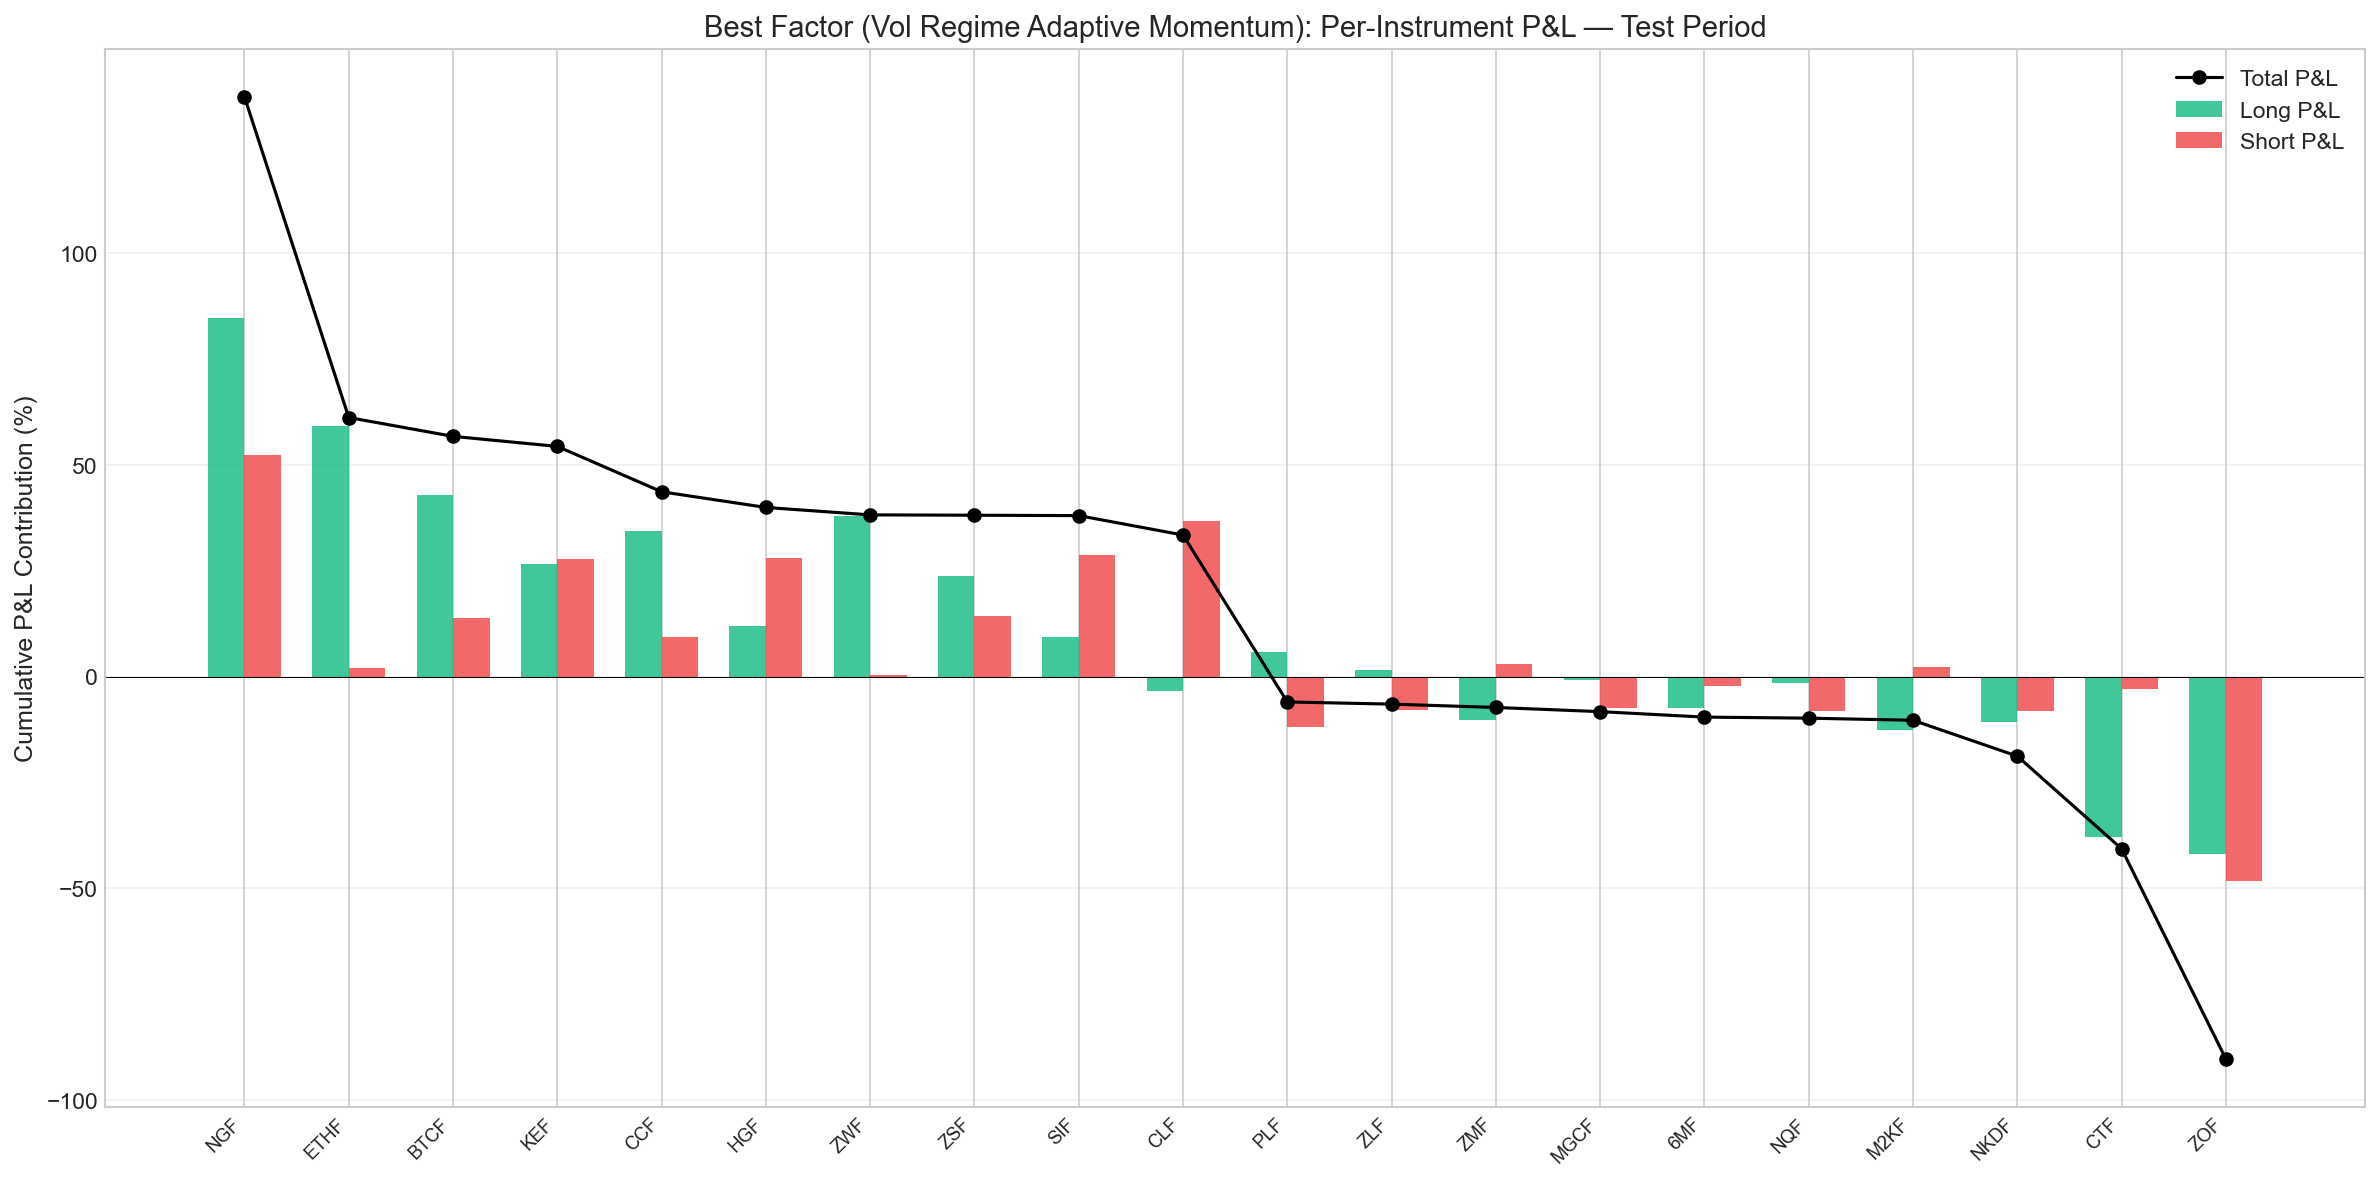
The chart above shows the long (green) and short (red) P&L contributions for the top 10 and bottom 10 instruments. The concentration of profits in Natural Gas and crypto highlights both the strategy's strength — capturing large moves in volatile markets — and its risk: a significant portion of performance depends on a handful of instruments.
How Evolution Improved Results
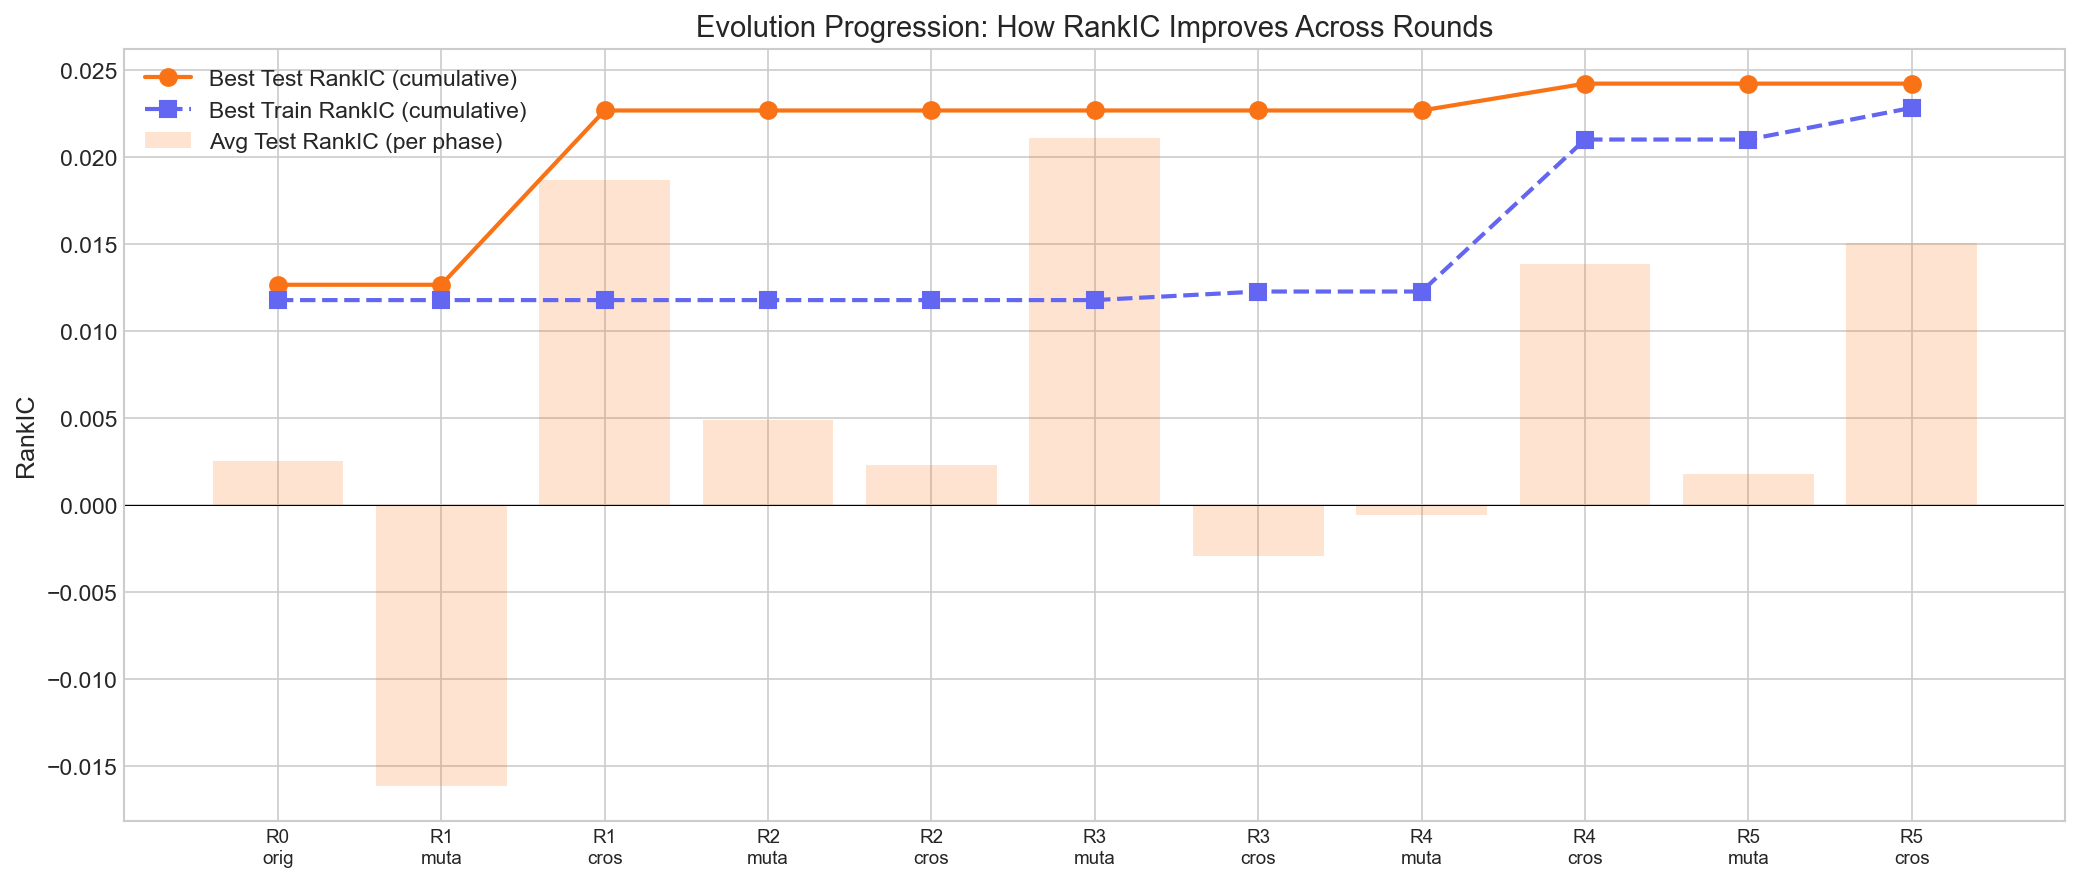
The evolution progression chart tracks the cumulative best RankIC across rounds. The original factors in Round 0 started with modest predictive power. The first crossover phase (R1) produced a large jump, discovering the volume divergence mean-reversion factor. Subsequent rounds continued to push the frontier, with the best factor emerging in the final rounds.
Key observations:
- Crossover outperformed mutation. The top 3 factors were all crossover products — combining signals from different research directions yielded better results than incremental tweaks.
- The AI learned from failures. Early factors like the basic volume-weighted momentum (near-zero RankIC) were critiqued by the feedback loop, and the AI pivoted to volume-price divergence and regime-adaptive approaches.
- Regime-adaptive logic emerged naturally. The AI discovered on its own that using different lookback windows in different volatility regimes produces more robust signals.
How Backtesting Works
Every factor is evaluated with a rigorous backtesting methodology:
Portfolio construction: Each day, all 53 commodities are ranked by factor value. The top 5 are held long, the bottom 5 are held short. Portfolio returns are computed as the average long return minus the average short return.
Train/test split:
- Training period: Feb 2016 – Dec 2022 (1,753 trading days)
- Embargo gap: 21 trading days (prevents leakage from rolling calculations)
- Test period: Feb 2023 – Feb 2026 (763 trading days)
Metrics computed separately for both periods:
- RankIC — Spearman rank correlation between factor values and next-day forward returns
- ICIR — Information ratio: mean IC divided by standard deviation of IC
- Sharpe Ratio — Annualized return divided by annualized volatility
- Annualized Return — Daily L/S return extrapolated to 252 trading days
- Max Drawdown — Largest peak-to-trough decline
- Calmar Ratio — Return divided by absolute max drawdown
Critically, the AI feedback loop only sees training metrics. Test metrics are computed but hidden from the evolution process, serving as a true out-of-sample validation.
Lessons Learned
Claude Code is surprisingly effective at quant research. Given a constrained DSL and clear evaluation metrics, it generates creative hypotheses and self-corrects through feedback loops. The regime-adaptive momentum factor — its best discovery — is something a human quant researcher might take days to iterate toward.
Evolution beats brute force. The mutation + crossover approach with selection pressure produced consistently better factors than the initial random exploration. Crossover was particularly powerful because it combined orthogonal signal types (momentum + volume + regime detection).
Constraining the search space matters. The DSL prevents the AI from writing arbitrary code and forces it to compose from validated primitives. This makes every factor interpretable and comparable.
Overfitting is the real enemy. Several factors showed strong training metrics but failed out of sample. The strict train/test separation with an embargo gap is essential. Future work could add walk-forward validation or ensemble methods.
What's Next
This was a single experiment run. The framework supports seeding future runs from prior results, enabling multi-generation evolution across experiments. Areas to explore:
- Larger evolution populations — more directions, more rounds
- Multi-factor portfolios — combining the top uncorrelated factors
- Walk-forward validation — rolling train/test windows instead of a single split
- Alternative asset classes — applying the same pipeline to equities or crypto
The code is orchestrated entirely through bash scripts calling claude -p (Claude Code in project mode), making it easy to modify prompts, adjust parameters, or swap in different LLM backends.
Full Factor Leaderboard
For reference, here's the complete leaderboard of all 20 factors sorted by test RankIC:
| Rank | Factor | Phase | Round | Test RankIC | Test Sharpe | Test Return | Test MaxDD |
|---|---|---|---|---|---|---|---|
| 1 | dual_horizon_momentum_directional_volume | crossover | 4 | 0.0242 | 1.18 | 25.7% | -17.9% |
| 2 | vol_regime_adaptive_momentum | crossover | 5 | 0.0232 | 1.72 | 38.7% | -15.8% |
| 3 | volume_divergence_mean_reversion | crossover | 1 | 0.0227 | 0.42 | 9.5% | -19.6% |
| 4 | trend_volume_gated_momentum | mutation | 3 | 0.0211 | 1.11 | 25.1% | -21.8% |
| 5 | breakout_momentum_rotation_skew | crossover | 1 | 0.0147 | 0.69 | 14.9% | -23.2% |
| 6 | volume_price_divergence_contrarian | original | 0 | 0.0126 | 1.03 | 24.3% | -16.9% |
| 7 | mean_reversion_zscore_90_60 | original | 0 | 0.0112 | 0.79 | 20.9% | -33.8% |
| 8 | trend_ortho_reversal_vol_tilt | crossover | 5 | 0.0069 | 0.95 | 22.2% | -24.1% |
| 9 | vol_confirmed_contrarian_breakout | mutation | 2 | 0.0049 | 0.25 | 5.8% | -26.2% |
| 10 | regime_adaptive_momentum_reversion | crossover | 2 | 0.0038 | -0.53 | -11.5% | -49.2% |
| 11 | sigmoid_vol_regime_blend | crossover | 4 | 0.0035 | 0.11 | 2.6% | -39.7% |
| 12 | volregime_breakout_momentum | original | 0 | 0.0029 | 0.07 | 1.8% | -41.1% |
| 13 | recency_momentum_closepos_volgate | mutation | 5 | 0.0017 | 0.16 | 3.4% | -31.8% |
| 14 | sector_rotation_accel_skew | original | 0 | 0.0013 | 0.05 | 1.2% | -29.2% |
| 15 | vol_breakout_momentum_tanh_gate | crossover | 3 | 0.0010 | -0.03 | -0.7% | -39.2% |
| 16 | multi_horizon_contrarian_vol_gate | crossover | 2 | 0.0008 | -0.22 | -5.1% | -36.6% |
| 17 | directional_vol_momentum | mutation | 4 | -0.0006 | 0.37 | 8.0% | -26.0% |
| 18 | vol_regime_adaptive_reversion | crossover | 3 | -0.0068 | -0.98 | -19.2% | -53.1% |
| 19 | volume_weighted_momentum_10d | original | 0 | -0.0155 | -1.24 | -40.2% | -79.2% |
| 20 | dual_regime_breakout_momentum | mutation | 1 | -0.0162 | -1.47 | -41.7% | -76.3% |